More popular techniques using machine learning.
The Regression/Estimation
This technique is used for predicting a continuous value, for example, predicting things like the price of a house based on its characteristics, or to estimate the Co2 emission from a car’s engine.
Classification
A Classification technique is used for Predicting the class or category of a case, for example, if a cell is benign or malignant, or whether or not a customer will churn.
Clustering
Clustering groups of similar cases, for example, can find similar patients or can be used
for customer segmentation in the banking field.
Association
Association technique is used for finding items or events that often co-occur, for example, grocery items that are usually bought together by a particular customer.
Anomaly detection
Anomaly detection is used to discover abnormal and unusual cases, for example, it is used for credit card fraud detection.
Sequence mining
Sequence mining is used for predicting the next event, for instance, the click-stream in websites.
Dimension reduction
Dimension reduction is used to reduce the size of data.
Recommendation systems
Recommendation systems; this associate’s people’s preferences with others who have similar tastes and recommends new items to them, such as books or movies.
Python is a popular and powerful general purpose programming language that recently emerged as the preferred language among data scientists.Machine-learning algorithms using Python and it works very well.
However, there are a lot of modules and libraries already implemented in Python, that can make your life much easier.
NumPy
Numpy is a math library to work with N-dimensional arrays in Python. It enables to do computation efficiently and effectively. It is better than regular Python because of its amazing capabilities. For example, for working with arrays, dictionaries, functions, datatypes and working with images need to know NumPy.
SciPy
SciPy is a collection of numerical algorithms and domain specific toolboxes, including signal processing, optimization, statistics and much more. SciPy is a good library for scientific and high performance computation.
Matplotlib
Matplotlib is a very popular plotting package that provides 2D plotting, as well as 3D plotting.
Pandas
Pandas library is a very high-level Python library that provides high performance easy to use data structures. It has many functions for data importing, manipulation and analysis.
In particular, it offers data structures and operations for manipulating numerical tables and timeseries.
SciKit Learn
SciKit Learn is a collection of algorithms and tools for machine learning . SciKit Learn is a free Machine Learning Library for the Python programming language. It has most of the classification, regression and clustering algorithms, and it’s designed to work with
a Python numerical and scientific libraries; NumPy and SciPy. Also, it includes very good documentation.
The pre-processing package of SciKit Learn provides several common utility functions and transformer classes to change raw feature vectors into a suitable form of vector for modeling.
Split data-setinto train and test sets to train your model and then test the model’s accuracy separately.
SciKit Learn can split arrays or matrices into random train and test subsets in one line of code.
Then set up algorithm. For example, you can build a classifier using a support vector classification algorithm.
CLF and initialize its parameters.
Now train the model with the train set by passing our training set to the fit method, the CLF model learns to classify unknown cases.
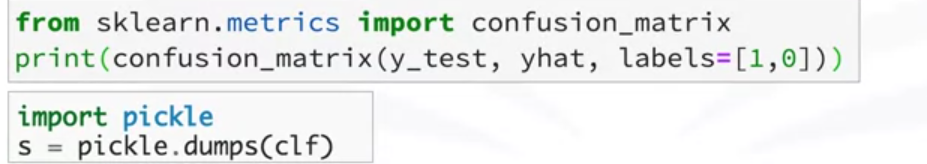
Then test set to run predictions, and the result tells us what the class of each unknown value is. Also, the different metrics to evaluate model accuracy.
For example, using a confusion matrix to show the results. And finally, save the model.
What is Regression?
Regression is a process of predicting continuous value. In regression, there are two types of variable one is dependent variable and another one is the independent variable.
The dependent variable can be state, target or final goal and try to predict.
Independent variable aslo knows as explanatory variables can be causes of the two-state. The independent used the X in the axis and the dependent variable used Y in axis.
Regression model depends on Y .Y is depend on X.
In the regression model-dependent values should be continuous value and can not be discrete value.
The independent variable or variables can be measured either categorical or continuous measurement scale.
Two types of Regression model :
1. Simple Regression: Simple regression one independent variable estimated the dependent variable. Simple regression can be linear or non-linear.
Linearity of regression based on relation between independent and dependent variable.
2. Multiple Regression: When more than one independent variable process this should be called multiple linear regression.
Application of regression :
1. Sales forecasting
2. Satisfactory Analysis.
3. price estimation
4. Employment income
Algorithms of Regression
1. Ordinal Regression
2.Poisson Regression
3.Fast forest quantile regression
4. Linear, polynomial, Lasso, stepwise, Ridge regression.
5. Bayesian Linear Regression
6. Neural Network Regression
7.Decision forest regression
8.Boosted decision tree regression
9. KNN( k-nearest neighbors)
Simple Linear Regression
Model Evaluation in Regression Model
The goal of regression is to build a model to accurately predict an unknown cause.
Two types of evaluation approaches that can be used to achieve this goal –
1. Train and Test on the same dataset
2. Train and Test split
How can we calculate the accuracy of our model?
One of the solutions is to select a portion of the dataset for testing. suppose one dataset has 10 records then we use the whole dataset for training and build a regression model. Then select a small portion of the dataset, such as number six to nine but without labels. This set called test set. which have the labels but this label are not used for prediction and is used only as ground truth.
In the labels are called actual values of the test set. When we use the test set feature into the regression model to predict the values. Then compare the actual values and predicted values, it shows how accurate this model is.
Train and Test on the same dataset: Train the model by using the whole the dataset and for the test it using a portion of the same dataset.
In a general sense, When test with a dataset which knows the target value for each data point, it able to obtain a percentage of accurate predictions for the model. So, train and test on the same dataset model evaluation approach would most likely have high training accuracy and low out-of-sample accuracy because of testing data knew all the labels from the training set.
What is the training accuracy?
Training accuracy is the percentage of correct predictions that the models make when using the test dataset. However, the high training accuracy isn’t necessarily a good thing. Look like high training accuracy may result in overfit data.
What is overfit?
overfit mean that the model is overly trained to the dataset which captures noise and produces a non-generalized model.
What is out-sample accuracy?
Out-of-sample accuracy is the percentage of correct predictions that the model make on data that the model has not been trained on. It’s important that the model has high out-of-sample accuracy because make to correct predictions on unknown data.
So , How can we improve out-of-sample accuracy?
one of the best ways is to train and test split.
Train and Test split :
In this time need to select a portion of the dataset for training. Example in one dataset has 10 records, first, one to six used for training and the other four are used for the test.
test feature compares with the training regression model for prediction. Then compare the actual values and predicted values.
another evaluation model called K-fold cross-validation :
The basic concept of K-fold cross-validation, the whole dataset is represented by the dot.
if we have K equals four fold then split up the dataset, for the first fold first 25% data point used for testing and rest for training. suppose it accuracy 80 %. Second fold, after first 25% data take 25% data point test and rest of training and it accuracy is 83 %. 3rd and 4th fold follow the same process and their accuracy 82% and 81% respectively. So overall all accuracy is ((80+83+82+81)/4)=81)%
Accuracy metrics for model evaluation :
Evaluation metrics are used to explain the performance of the model. For calculate, the linear regression model needs to compare actual values and predicted values.
Evaluation metrics , provide a key role in the development of a model. Different types of model evaluation metrics are used to calculate the linear regression model.
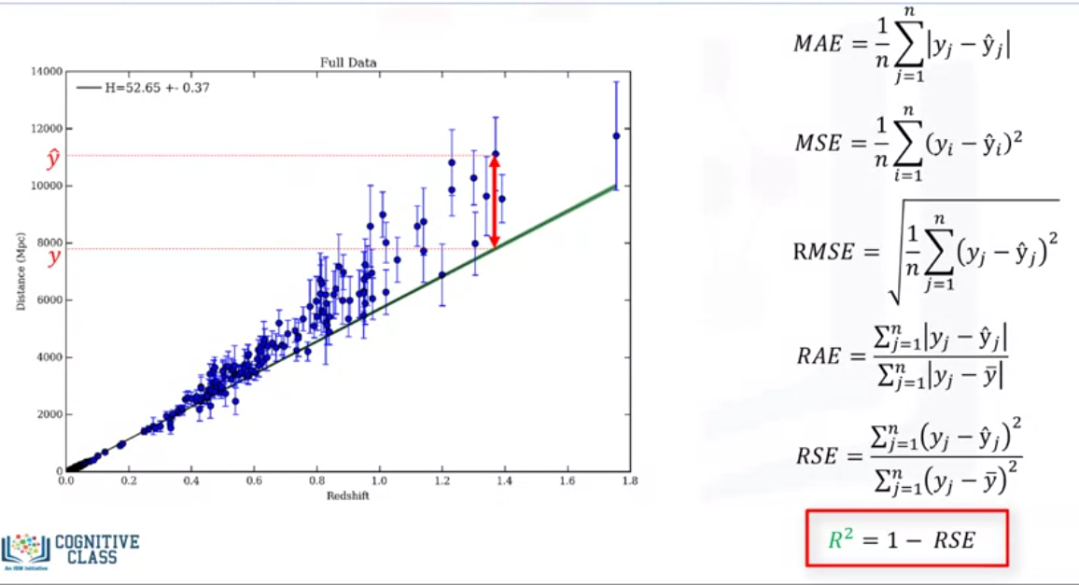
1. Mean absolute error (MAE) :
—Mean absolute error is the mean of the absolute value of the error.
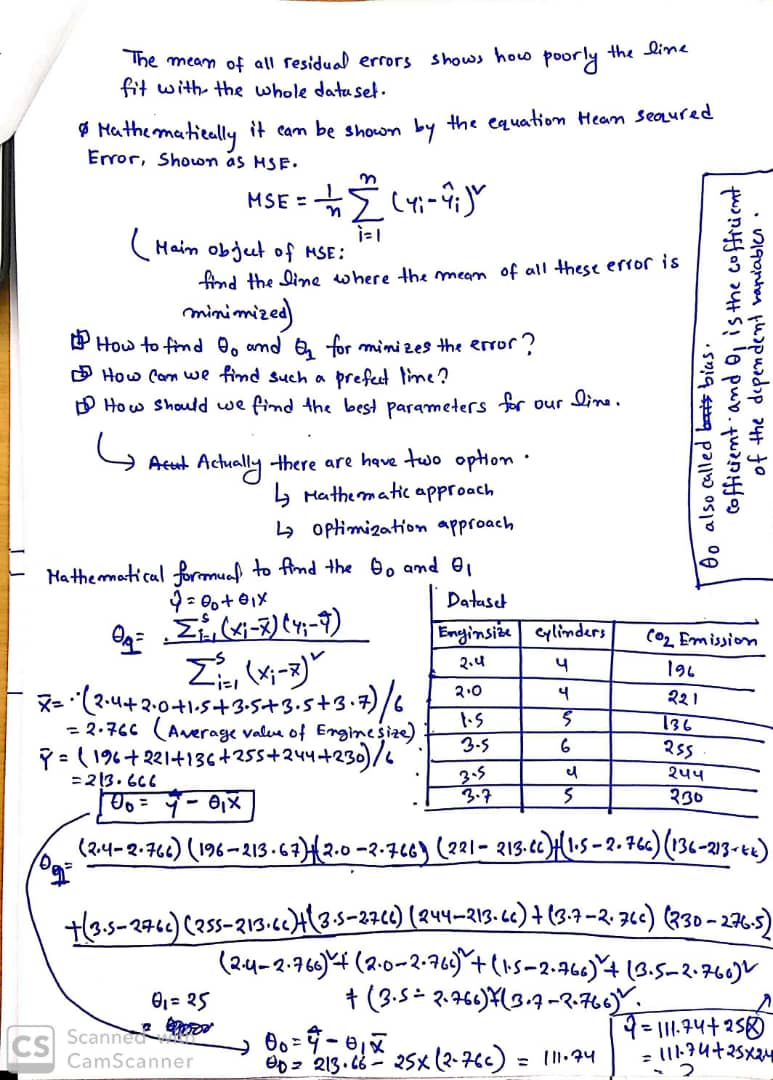
2. Mean sequred error ( MSE) :
—Mean square error is the mean of the squared error
3. root mean sequred error (RMSE)
—Root mean squared error is the square root of the mean squared error.
4. Relative absolute error (RAE)
—The relative absolute error also is known as the residual sum of the square where y bar is a mean value of y, takes the total absolute error and normalized by dividing total absolute error of the simple predictor.
5. Relative squared error (RSE)
—Relative squared error is very similar to relative absolute error but it is widely adopted by the data science community. It is used for calculating R Squared.
—R squared
R squared is not an error per se, but it is a popular metric for the accuracy of the model. it represents how close the data value are to the fitted regression line. if higher the R Square is better the model fits the data.
What is the error?
In the context of regression, the error is different between the data point and the trend line generated by the algorithm. if there are have multiple data point, the error can be determined in multiple ways.
Multiple Linear Regression
Multiple Linear regression is the extension of simple linear regression model. Basically multiple linear regression have two applications.
First , independent variable effectiveness on dependent variable or prediction.
Second , predicting impact of changes that mean understand how to dependent variable changes when we change the independent variable.
Multiple linear regression is the methods to predicting continuous variable. It uses multiple variable called independent variables or predictors.
In the multiple linear regression , the target value Y , is a linear combination of independent variable X.
equation :
Dependent variable = intercept + coefficient *average value of independent variable 1 + coefficient *average value of independent variable 2 +………
Multiple linear regression is very useful because you can examine which variable are significant predictors of the outcome variable also find out how each feature impacts the outcome variable.

Mathematically , we can write the first equation by using second equation.
Second equation mean a dot product of two vectors such as parameter vector and the feature set vector. Generally this equation for multidimensional space as theta transpose x. Where theta is an n by one vector of unknown parameters in a multi-dimensional space and x is the vector of features sets.
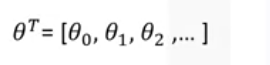
Theta is a vector of coefficient and is supposed to be multiplied by x. Theta is also called the parameters or weight vector for regression equation.
The first element of the feature set would be set to one , because it turns that theta zero into the intercept or biased parameters when the vector is multiplied by the parameter vector.
N. B : theta transpose x is a one dimensional space is the equation of line . So, it only used in simple linear regression.
For higher dimensional when we have multiple input it called the plane or hyperplane.
How do we find the optimized parameters ?
Optimized parameter : optimized parameter are the ones which lead to the model with the fewest error.
How to estimate theta ?
- ordinary least squares : ordinary least square tries to estimate the value of the coefficient by minimizing the mean square error. It uses the data as a matrix and uses linear algebra operations to estimate the optimal values for the theta. The problem is time complexity of calculating matrix operation , it take very long time to finish. if you have less then 10k data point you can go thought it.
- An optimization algorithm : find the best parameter we can use the optimization algorithm. we can use the gradient descent which is start optimization with random values for each coefficient, the calculates the error and tries to minimize it through y changing of the coefficient in multiple iterations. if we have large amount of data set then we can use the gradient descent.
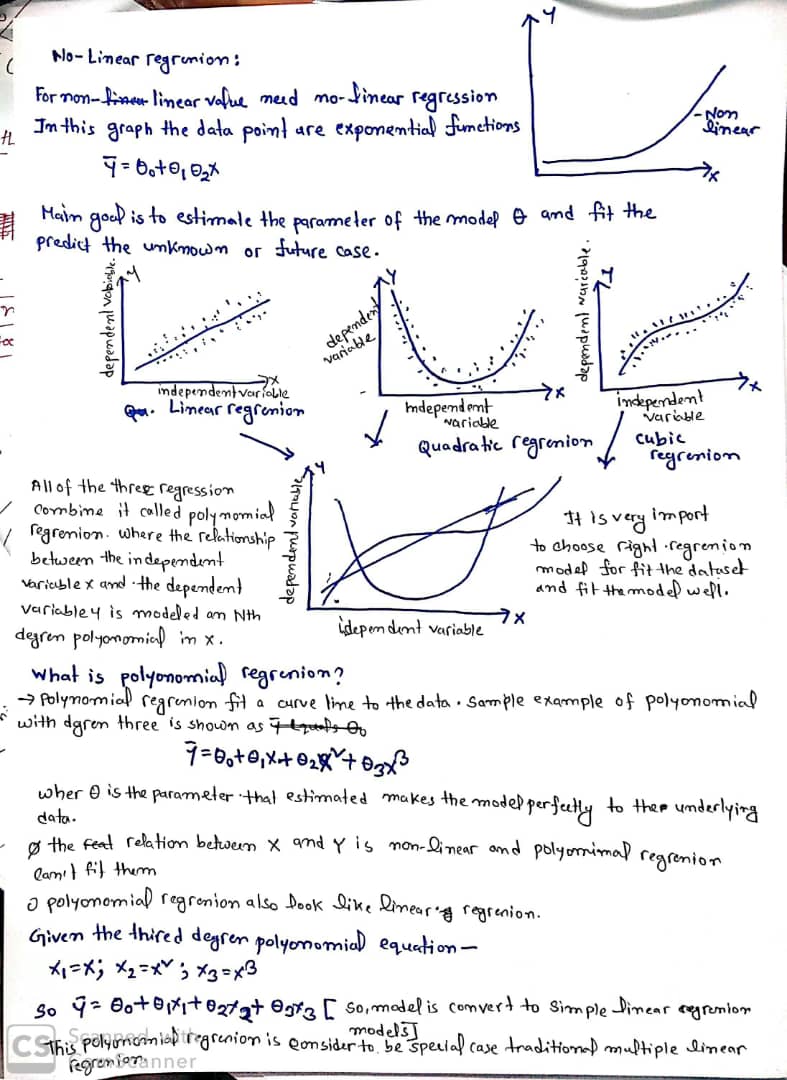
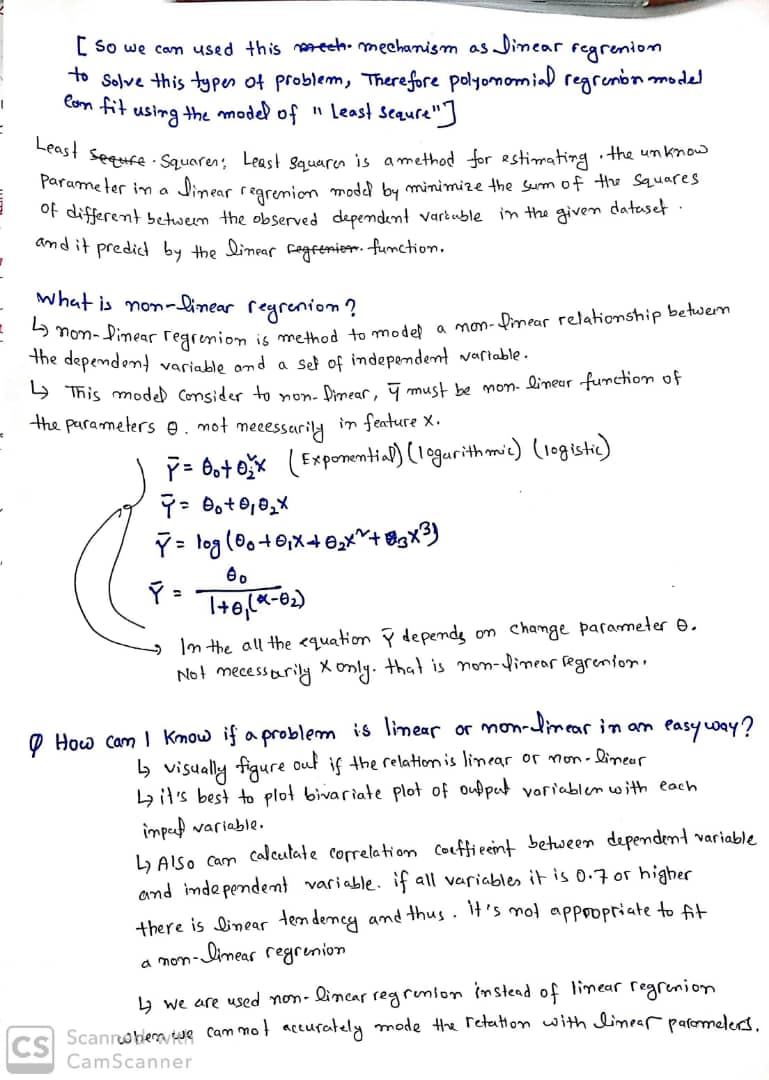
Non-Linear Regression
If the data shows a curvy trend then linear regression would not produce very accurate result when compared to no-linear regression. we use the linear regression when the data is linear.
Chowdhury Mohammad Masum Refat , Research Assistant, Department of Mechatronics Engineering, Kulliyyah of EngineeringInternational Islamic University Malaysia,